| Regel 13: | Regel 13: | ||
{{Activity links |
{{Activity links |
||
|Consumes=Bfn Knowledge gap oyster production on dykes, |
|Consumes=Bfn Knowledge gap oyster production on dykes, |
||
| − | |Part of=Bfn |
+ | |Part of=Bfn Oyster production on dykes, |
}} |
}} |
||
{{Connects |
{{Connects |
||
Versie van 4 okt 2017 om 12:41
| Bfn Design and installation | |
|---|---|
| Context | Bfn Building for Nature project |
| Decompositie type | IOR |
The research was conducted in two parts, a laboratory experiment and a field experiment. The combined effect of different food supply and inundation time were tested in a laboratory experiment (Figure 1.) where oysters were exposed to inundation times of 62%, 82% and 100% inundation and water of different ratios of organic (phytoplankton) and inorganic (silt) material (10000 cells/ml algae, (Rhodomonas salinas) with 0mg, 100mg or 200mg silt).

A field experiment was set up to test the effects of inundation time (50% or 70% and hydrodynamics (low and high) on the growth and survival of the oysters. The breakwaters at Schelphoek and at Goese Sas were chosen as locations on which to place a new series of oyster sacks. These areas are both accessible for researchers, but are not frequented by the public. Unfortunately the field experiment was much afflicted by damage and washing away of equipment as well as theft of the oysters so that the oysters at Goese Sas were not found at the end of the project to no data was available for the whole 10 months. The oysters at Schelphoek did remain long enough to gather data over 10 months and these are presented below. At each location three oyster sacks were attached to a 1 x 2 m steel mesh sheet with cable ties, and placed on the 'kreukelberm'. At each corner the steel sheets were attached with cable ties onto a steel anchor point set in a concrete block (each weighing around 27 kg). These blocks fit in between the rocks on the kreukelberm to help secure the mattress from water induced movement. (Figure 2.) On each set of oyster sacks a sign was attached to dissuade potential thieves (Figure 3.).


Unfortunately the signage was not enough to dissuade potential thieves. To increase security cages or gabions, made of the same steel mesh as the mattresses were constructed to replace the mesh sheets with lids that could lock with high grade marine pad locks. Oysters were then placed in the gabions which were set on the 'kreukelberm' and weighted with the same concrete blocks to prevent them washing away (Figure 4.).

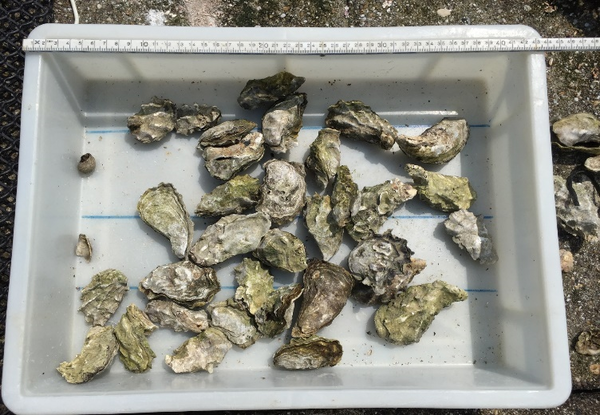
The oysters were measured three times during the summer of 2016. The oyster sacks were removed from the gabions and opened carefully. Each individual sack was emptied into a photo tray (Figure 5.) and the empty sack was weighed with an electronic balance. The number of live and dead oysters was recorded for each sack.


The live oysters were then weighed separately before being returned to the oyster sack along with the empty shells of the dead oysters to maintain the scouring effect. The sack was sealed with a cable tie and put back into place in the cages. The average weight per living oyster could hereby be calculated and extrapolated to estimate growth rate (Van den Brink en Capelle 2017).
De View-Navigation (VN) pagina's.
De links naar andere pagina's.
| Produceert | |
|---|---|
| Consumeeert | Bfn Knowledge gap oyster production on dykes |
| Onderdeel van | Bfn Oyster production on dykes |
| Instantie van | |
| Betreft |
Connectie.
| Connectie type | seq |
|---|---|
| Connecteert naar | Bfn Data collection and data analysis |
| Conditie | |
| Opmerkingen |
De pagina's die linken naar deze pagina.
Dit element heeft geen subelementen.
| Komt van | Type | Connectie type | Conditie | Waarde | Opmerkingen |
|---|---|---|---|---|---|
| Bfn Literature review oyster cultivation on dykes | Connects | seq |


