| PP Changes in height | |
|---|---|
| Context | PP Ontpoldering Perkpolder |
| Decompositie type | IOR |

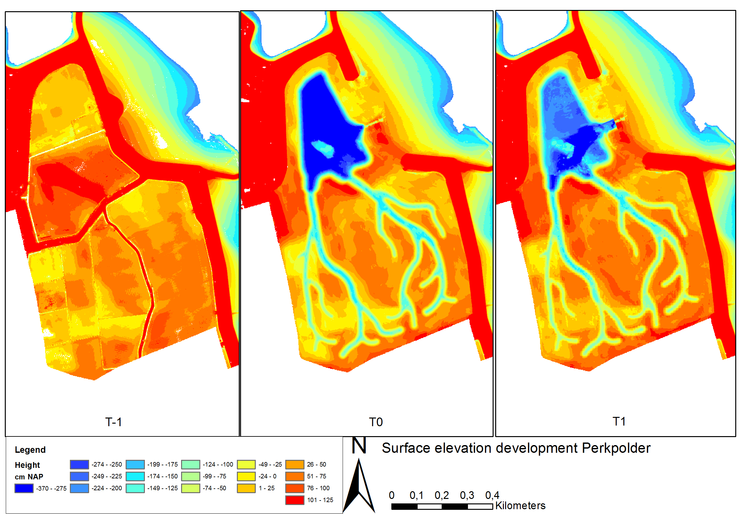
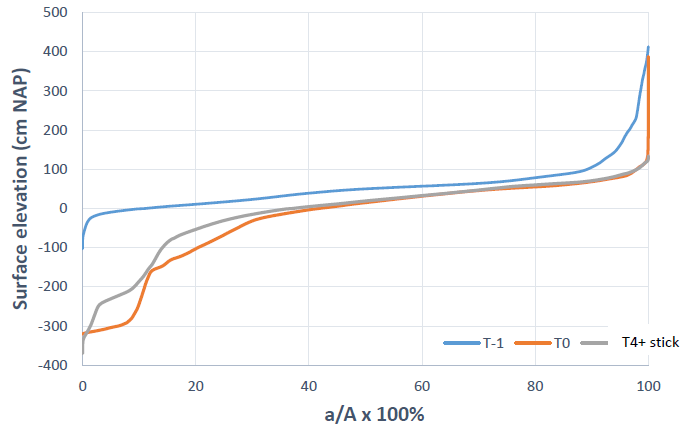
The maps in figure 1 show the surface levels at various moments in time, in December 2013 (T-1), June 2015 (T0), and April 2016 (T4 + stick). The last map is a composite of T4 multi-beam data, LiDAR measurements and the bamboo stick measurements. The hypsometric curves (figure 2) show the changes in the surface level. The differences between T-1 and T0 are due to excavation work of the contractor. The top layer of the surface was removed, a pond in the northern part was created including creeks in the south. After opening most of the changes are visible in the lower part of the hypsometric curves. This is caused by the large sedimentation in the pond and the sedimentation at the creek bedding around -1,0 m NAP .

De View-Navigation (VN) pagina's.
De links naar andere pagina's.
| Produceert | |
|---|---|
| Consumeeert | PP Sedimentation balance |
| Onderdeel van | PP Morphology and water movement processes |
| Instantie van | |
| Betreft |
De pagina's die linken naar deze pagina.
Dit element heeft geen subelementen.
| Komt van | Type | Connectie type | Conditie | Waarde | Opmerkingen |
|---|---|---|---|---|---|
| PP Morphological development | Connects | seq |


