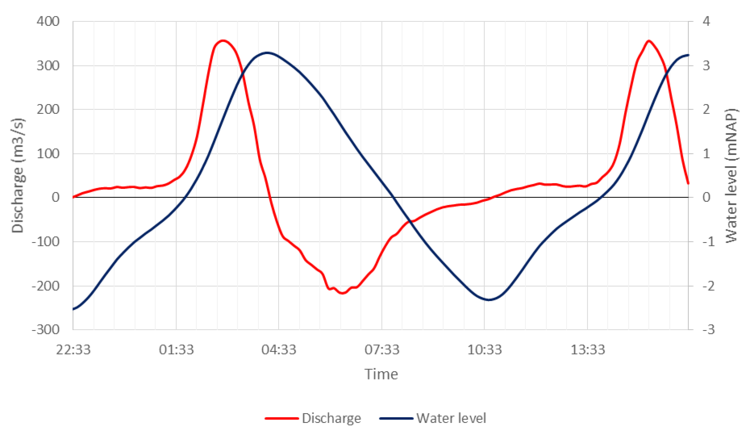
The normal velocities and discharges at the inlet are flood-dominant, i.e. the peak flood values are larger than the peak ebb values. This is mainly related to the fact that the peak flood velocities occur at a higher water level (and water depth) than the peak ebb velocities (figure 1). At Walsoorden, Mean High Water (MHW) is +2.6 m NAP, and Mean Low Water (MLW) is -2.1 m NAP in 2015. For the T0 situation (figure), the tidal storage based on MHW and MLW is 1.6 million m3 . This corresponds well with the tidal prism based on estimated discharges from the velocity, water level and bed level data, which results in an average volume of 1.7 million m3 (November 2015).
By using the T0 elevation data from June of 2015, and the measured water levels at Walsoorden measurement stations, the flood and ebb discharges in and out of the Perkpolder tidal basin are calculated. The Perkpolder basin is regarded in this calculation as a storage reservoir, and the water levels in this reservoir have an instantaneous response to water levels at Walsoorden. These calculations confirm the earlier-mentioned flood-dominance. The flood-dominance is larger during the spring tide, while during neap tide the flood-dominance is not very visible.
- Perkpolder tidal restauration, one year after realisation, draft progress report, Boersema, M., J. van der werf, P. de Louw, T. Ysebaert, T. Bouma, Centre of expertise Delta Technology, 27 november 2016.
Zie ook
- Perkpolder tidal restauration, one year after realisation, draft progress report
- Aspects of sediment- and morphodynamics of subtidal deposits of the Oosterschelde (the Netherlands)
- Understanding the morphological development of the Oesterdam nourishment
- Eastern Scheldt inlet morphodynamics
- Perkpolder Tidal Restauration
- Oesterdam sand nourishment - ecological and morphological development of a local sand nourishment
- Tidal channel development at the Oesterdam sand nourishment
- Rammegors tidal restauration, final report
- Establishing vegetated foreshores to increase dike safety along lake shores
- The Benthic Ecosystem Quality Index (BEQI), intercalibration and assessment of Dutch coastal and transitional waters for the Water Framework Directive. Final report


