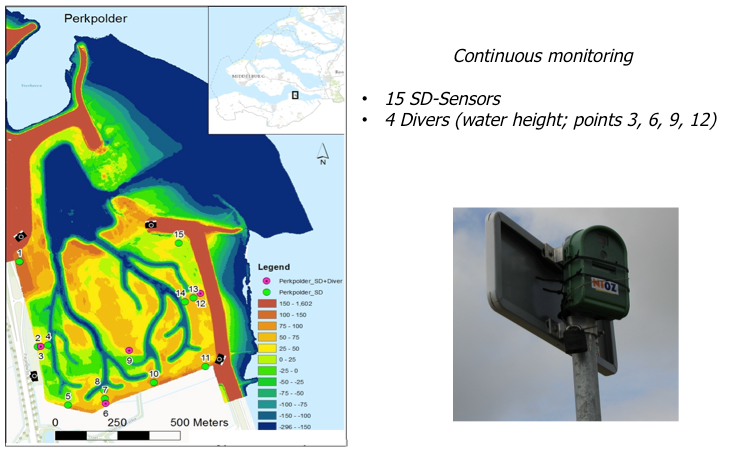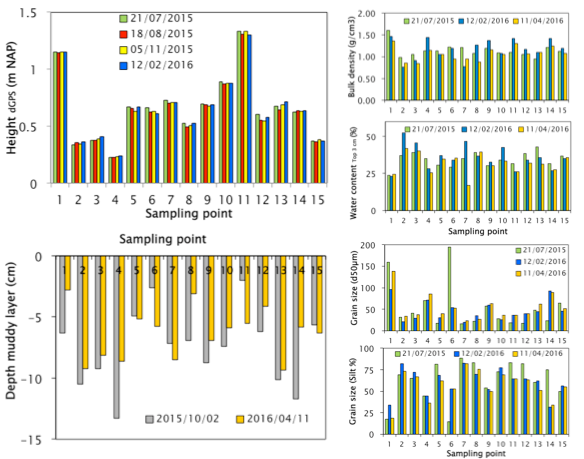
There has been regular monitoring of the abiotic sediment properties at 15 locations in Perkpolder (figure 1). For the abiotic parameters we measured elevation using a dGPS, the depth of the accumulated soft mud layer on top of the compacted soil, soil compaction using the pentrologger, and soil redox. Sediment samples were taken for grain size (top 3 cm & top 20 cm) and bulk density. Changes in sediment height have also been monitored using SED-sensors, which monitor the sediment height continuously with a 2 mm resolution (Hu et al. 2015). A student of the HZ has been measuring groundwater levels. Some preliminary results on the abiotic sediment properties at 15 locations in Perkpolder are shown in figure 2, but require further analyses before drawing conclusions.

Silt content

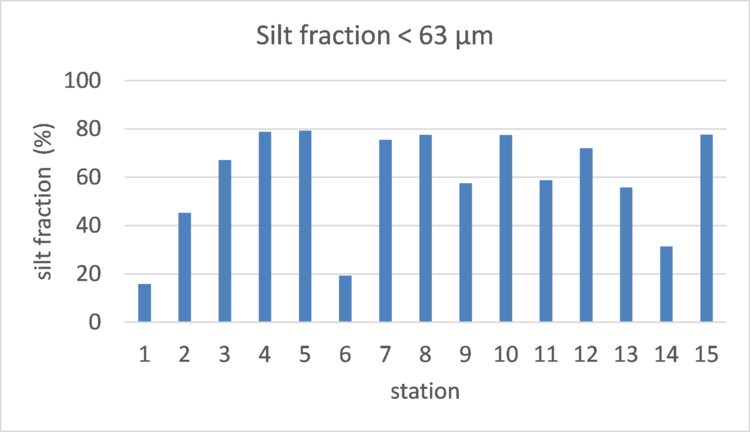
The elevation of the sampling stations ranged between +0,23 and +1,33 m NAP, corresponding to an emersion time of 50 – 75 %. The average median grain size was 56 ± 12 μm, ranging between 21 and 182 μm. The silt fraction was in general high, on average 59 ± 5,5 % (figure 3). In terms of ecotope classification, we can consider the Perkpolder intertidal area as middle litoral ecotope (25-75% emersion), low dynamic. With respect to salinity the Perkpolder area is situated at the transition zone between brackish and salt water. The measured sedimentation rate at the 15 stations in November 2015 varied between 2,0 and 13,3 cm.
- Perkpolder tidal restauration, one year after realisation, draft progress report, Boersema, M., J. van der werf, P. de Louw, T. Ysebaert, T. Bouma, Centre of expertise Delta Technology, 27 november 2016.
Zie ook
- Perkpolder tidal restauration, one year after realisation, draft progress report
- Rammegors tidal restauration, final report
- Perkpolder Tidal Restauration
- Development of the benthic macrofauna community after tidal restoration at Rammegors
- Oesterdam sand nourishment - ecological and morphological development of a local sand nourishment
- Biogeomorphology of Spartina anglica tussocks, GIS based comparison of contrasting sites at the Westerschelde and Blackwater estuary
- The Benthic Ecosystem Quality Index (BEQI), intercalibration and assessment of Dutch coastal and transitional waters for the Water Framework Directive. Final report
- The conservation of eroding intertidal flats through nourishments: Ecological development on the Oesterdam tidal flat (Oosterschelde, the Netherlands)
- Understanding the morphological development of the Oesterdam nourishment
- Aspects of sediment- and morphodynamics of subtidal deposits of the Oosterschelde (the Netherlands)


