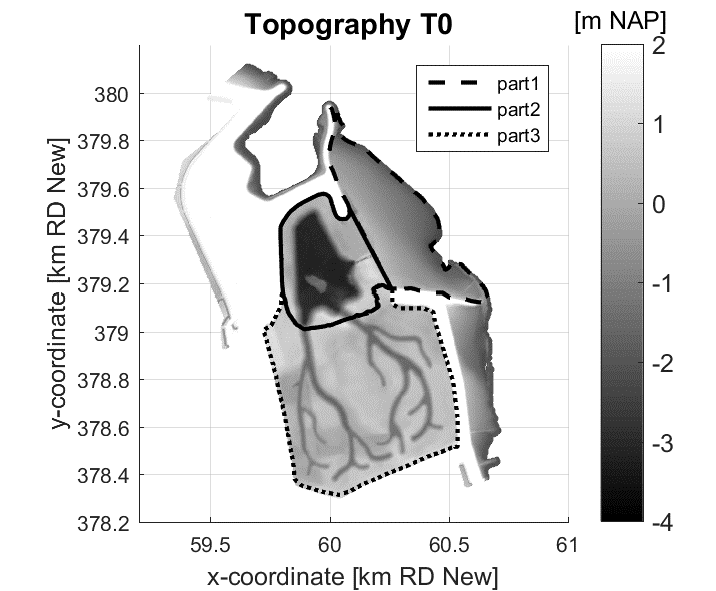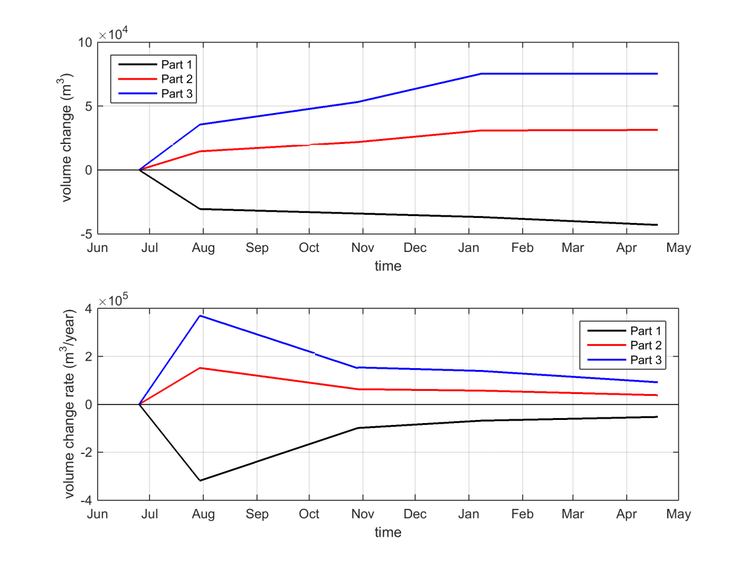
The volume changes reflect the relaxation of the volume changes in time. The outer area (Part 1) loses sediment, while the inner parts (Parts 2 and 3) gain sediment (see figure 1). The sediment volume of the inner area, Parts 2 and 3, increases with 107 x 103 m3 between June 2015 and April 2016, or 130 x 103 m3/year (figure 2). This sediment comes from local erosion of the inlet (sand and mud) and the net suspended sediment inflow (mostly mud). The initial sedimentation in Perkpolder is dominated by the local erosion effect; therefore the second process is more important.
The sediment volume of the inner area increases with 57 x 103 m3 between July (T1) and April 2016, i.e. 78 x 103 m3/year (figure 2). This corresponds to 47 x 103 tons/year, assuming a dry bed density of 600 kg/m3 (in between the density of freshly deposited mud and a consolidated muddy bed). The tidal prism is approx. 1.7 million m3. For a typical mud concentration of 50 mg/l, this corresponds to a maximum net sediment influx of 85 tons/tide or 60 x 103 tons/year, implying a trapping efficiency of about 80%.

- Perkpolder tidal restauration, one year after realisation, draft progress report, Boersema, M., J. van der werf, P. de Louw, T. Ysebaert, T. Bouma, Centre of expertise Delta Technology, 27 november 2016.
Zie ook
- Perkpolder tidal restauration, one year after realisation, draft progress report
- Perkpolder Tidal Restauration
- Aspects of sediment- and morphodynamics of subtidal deposits of the Oosterschelde (the Netherlands)
- Rammegors tidal restauration, final report
- Oesterdam sand nourishment - ecological and morphological development of a local sand nourishment
- Eastern Scheldt inlet morphodynamics
- Understanding the morphological development of the Oesterdam nourishment
- The conservation of eroding intertidal flats through nourishments: Ecological development on the Oesterdam tidal flat (Oosterschelde, the Netherlands)
- The Benthic Ecosystem Quality Index (BEQI), intercalibration and assessment of Dutch coastal and transitional waters for the Water Framework Directive. Final report
- ANT Oosterschelde: Long-term trends of waders and their dependence on intertidal foraging grounds


