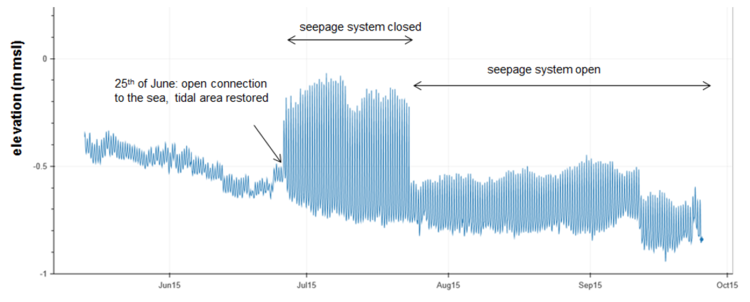
Figure 1 shows the time series of the hydraulic head (screen depth 12 m below ground level) for a location between two vertical seepage pipes, near monitoring point EC102 (see: this page, figure 1). The tidal fluctuation of the hydraulic head increased from 10 cm (before 25 June) to 60 cm (after 25 June) resulting from the local sea level rise (development of the new tidal area). The increase of the daily mean hydraulic head was 16 cm. The seepage system was closed during the first month to determine direct effects of the local sea level rise where after the seepage system was thrown open. This resulted in a decrease of about 29 cm of the daily mean hydraulic head which shows that the hydraulic head could be reduced more than the effects of the local sea level rise which is more than needed. Direct effects in the agricultural area due to the new tidal area and seepage system were only detected for monitoring points within 100-200 m from the tidal area.
The measured average discharge of the seepage system was over the period October – December 2015 410 m3/day and the average salinity was 35 mS/cm (compare seawater with a salinity of 35 ‰ and temperature of 150C has a conductivity of 42 mS/cm).
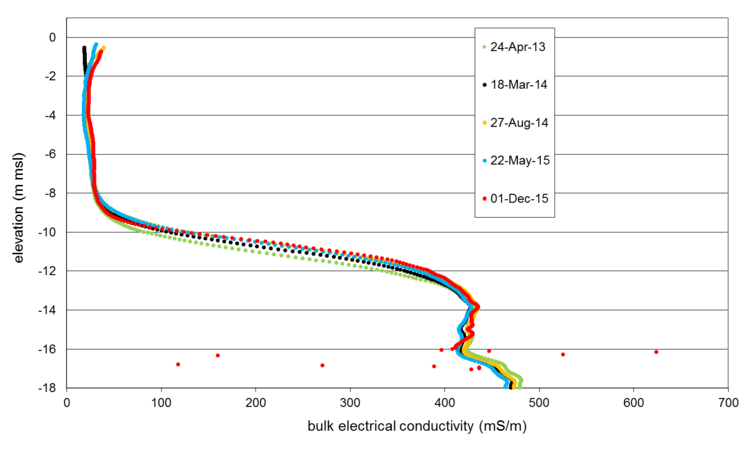
As expected, the EM-SlimFlex measurements in December 2015 didn’t show any changes in fresh-saline interface due to the development of the new tidal area (figure 2). Changes of salinity are induced by transport processes which are far more slowly than changes in hydraulic head caused by pressure transfer.

- Perkpolder tidal restauration, one year after realisation, draft progress report, Boersema, M., J. van der werf, P. de Louw, T. Ysebaert, T. Bouma, Centre of expertise Delta Technology, 27 november 2016.
Zie ook
- Perkpolder tidal restauration, one year after realisation, draft progress report
- Rammegors tidal restauration, final report
- Perkpolder Tidal Restauration
- Understanding the morphological development of the Oesterdam nourishment
- The Benthic Ecosystem Quality Index (BEQI), intercalibration and assessment of Dutch coastal and transitional waters for the Water Framework Directive. Final report
- Eastern Scheldt inlet morphodynamics
- Impact of cable bacteria on the biogeochemical cycling in a seasonal hypoxic basin
- Oesterdam sand nourishment - ecological and morphological development of a local sand nourishment
- Tidal channel development at the Oesterdam sand nourishment
- Aspects of sediment- and morphodynamics of subtidal deposits of the Oosterschelde (the Netherlands)


